One description, several connections: exploring a heritage knowledge graph
A short museum description can contain several kinds of information at once. It may identify an object, locate it within a building, place it in a historical period and explain its decorative purpose. We read these details together, following the sequence of the sentences.
A knowledge graph offers another way to explore that information: through individual elements and the relationships between them.
The REEVALUATE Text Contextualization tutorial demonstrates this change of perspective using a description of a mosaic. Starting with a paragraph, the demonstration generates a structured result that can be inspected both as text and as a visual network.
For someone unfamiliar with knowledge graphs, the most useful starting point is a simple question: what are we actually looking at?
A paragraph becomes a network
The input in the tutorial describes a polychrome mosaic with a fawn and dog. It includes references to Titus Macer’s House, a historical period and the room associated with the mosaic’s decorative use.
In the resulting graph, information is arranged around connected circles. These circles are called nodes. The lines between them represent relationships.
The display includes labels referring to the mosaic, a place, a time span and an object type. Instead of encountering these details in the order of a paragraph, the reader can begin with one element and follow its connections.
This is a different reading experience. A paragraph guides us through a narrative; a graph invites us to examine how particular pieces of information have been linked.
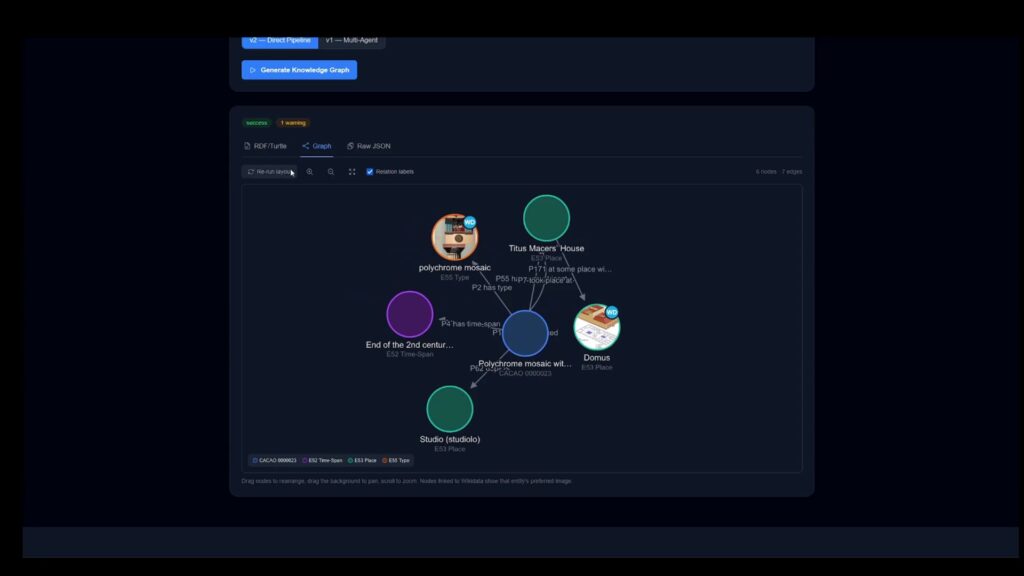
Figure 1. Reading the connections: the graph view displayed in the REEVALUATE Text Contextualization tutorial. The image shows generated output from the demonstration, rather than a verified historical knowledge record.
Follow a relationship, not just a line
The lines are as important as the circles.
Two elements appearing next to each other does not explain their relationship. The connection might concern location, classification, production or a period of time. Reading the relationship label helps identify the claim being represented.
For example, identifying where an object is located answers a different question from identifying where it was produced. Both involve a place, but they communicate different aspects of its history.
The tutorial’s graph view includes a control for displaying relationship labels, alongside zoom and layout controls. The interface also explains that nodes can be dragged and the background moved.
These features help users inspect a crowded visualisation. Moving a node changes the arrangement on screen; it does not, by itself, change the meaning of the relationship. The layout is a viewing aid, while the labels carry the information.
The same result has more than one view
The demonstration also offers tabs labelled “RDF/Turtle”, “Graph” and “Raw JSON”.
These provide different ways to inspect the generated result. The graph makes connections visible spatially. The structured-text view exposes identifiers, labels and relationship statements in a format that software can process.
Readers do not need to understand every technical expression to appreciate the distinction. The visual network is a presentation of underlying data, rather than a separate illustration added afterwards.
For a curator and a technical colleague working together, the views could support different parts of the same discussion: one person may begin with a visible connection, while the other examines how that connection is encoded.
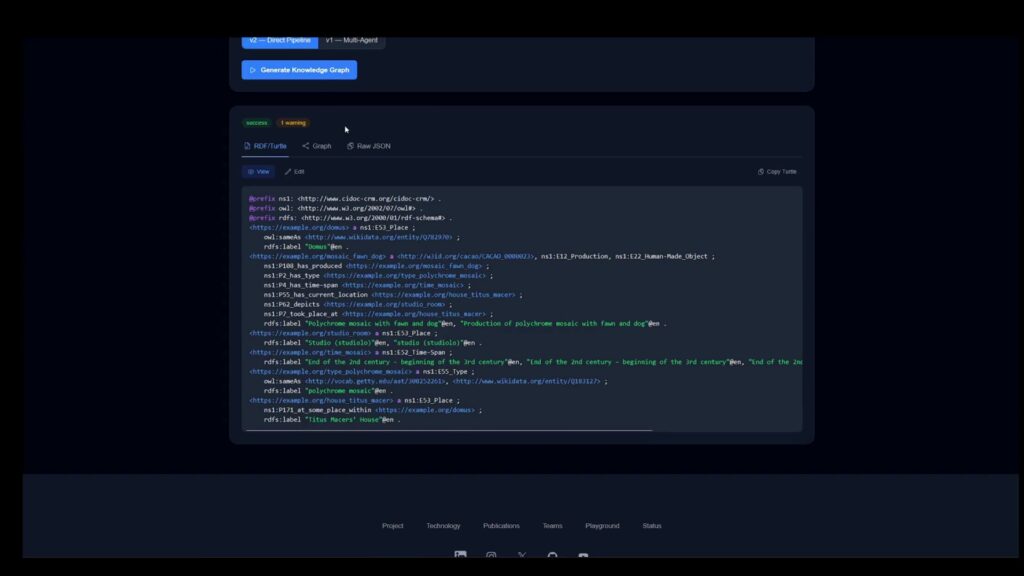
Figure 2. Looking beneath the visualisation: the RDF/Turtle view presents the generated information as structured statements. Source: REEVALUATE Text Contextualization tutorial.
Try reading it in three passes
A useful way to approach the demonstration is to examine one connection at a time.
First, find the subject. Locate the node corresponding to the object described in the source text.
Then, follow one relationship. Read the connection label and identify the element at the other end. Try expressing the relationship as an ordinary sentence.
Finally, return to the description. Check whether that sentence reflects what the source actually says.
This exercise separates understanding the display from accepting its contents. A graph can make a proposed relationship easier to inspect, but its appearance does not establish that the relationship is correct. The tutorial itself displays a warning indicator alongside its generated result.
The value of the demonstration lies in making this representation tangible. A paragraph becomes something readers can explore through objects, places, periods and connections. Learning to read those connections gives cultural heritage professionals another way to discuss how information about their collections is organised.
Watch the Text Contextualization tutorial, or explore the other demonstrations on the REEVALUATE tutorials page.
REEVALUATE has received funding from the European Union’s Horizon Europe Research and Innovation Programme under Grant Agreement No. 101132389.